In the hands of a beginner, a lightsaber is at best a reading lamp, but in the hands of a master, it is a powerful weapon.
The same applies to the ABAP Debugger. But don’t worry, you don’t need years of Jedi training. This article provides you with the basics to take your first steps with the ABAP Debugger. Whether you’re a consultant, user, or developer, here you’ll learn the fundamentals that will help you master the world of debugging. Ready for your Padawan training? Let’s go!
First, we’ll look at the basic operation and structure of the debugger. Then, I’ll present effective strategies for identifying and locating errors. Once found, we’ll naturally want to fix the problem. I’ll give you helpful tips and tricks for finding and testing potential solutions. Finally, there’s a troubleshooting section with solutions if you get stuck.
What is the ABAP Debugger?
This is an ABAP program specifically designed to analyze and execute other ABAP programs step by step. Using breakpoints, you can pause at any point in the program code and inspect the current environment variables.
Why should I learn the ABAP Debugger?
Debugging allows you to quickly find and fix problems like missing customization in an SAP system. You can also trace process flows to explain them to your colleagues, for example. You’ll gain the superpower of seeing behind the scenes.
Ready for Takeoff – Your start to Debugging
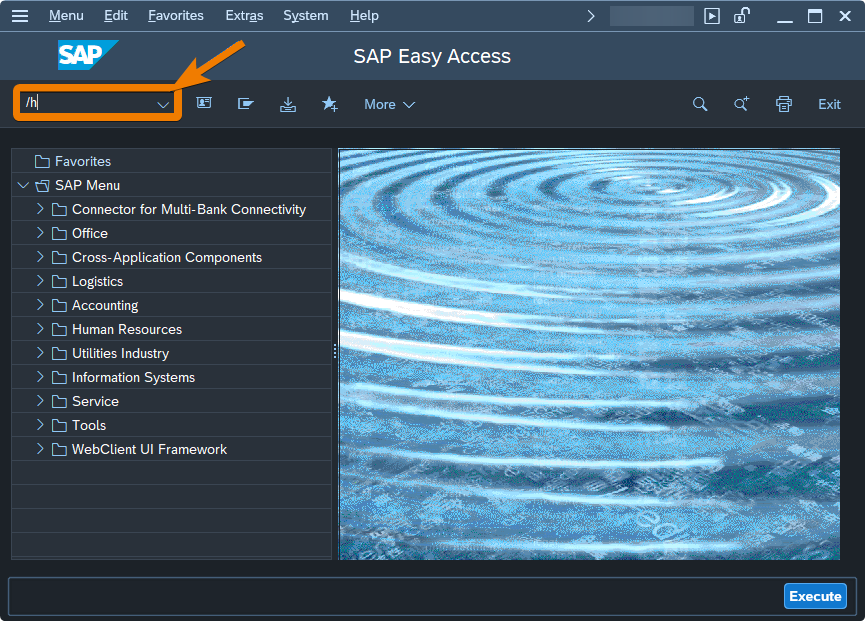
The simplest way to start the debugger is to enter /h in the transaction field of the SAP GUI and press Enter. Initially, nothing will happen. However, as soon as you click on a field or enter any other input, the debugger will open.
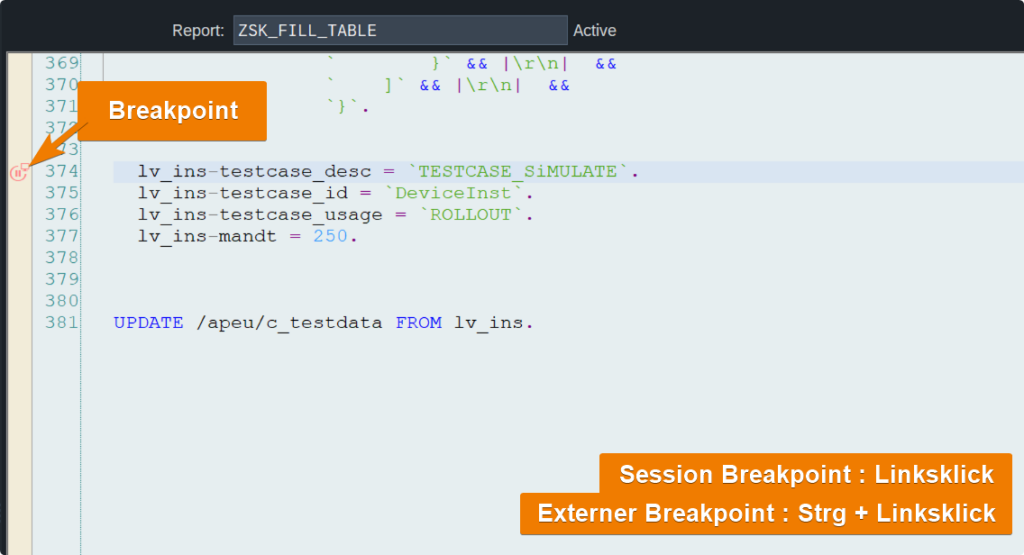
If you want to pause at a specific point in the program, open the program in transaction SE80 or SE24, right-click on the yellow bar to the left of the program code, and select “Set Session Breakpoint”. When you run the program again, the debugger will open and pause at the breakpoint.
Basic structure
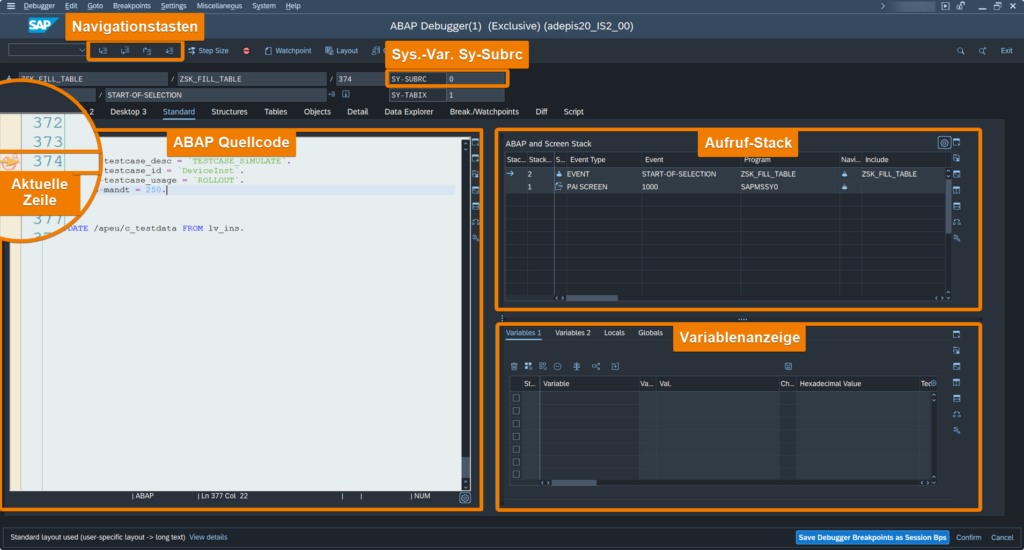
On the left, you see the ABAP code that will be executed next. The yellow arrow marks the line where the program stopped. The arrow always points to the line that will be executed next.
The stack is visible on the right. The call stack allows you to keep track of active subroutines, methods, or functions in a program during runtime. When a subroutine, method, or function is called, a new entry is created on the stack. In the screenshot, the stack has two entries. The arrow on the top entry indicates that the program ZSK_FILL_TABLE is currently executing. Once this program has finished, the top entry is removed from the stack, and the program below it continues to execute. Double-clicking the first line of a stack entry allows you to access the source code of that program.
Below the stack is the variable display. The ABAP debugger distinguishes between the sections “Variables 1” and “Variables 2,” “Locals,” and “Globals.” The first two sections are freely available. Here you can display the current values of variables. You do this by either double-clicking a variable in the code area or by typing the variable name and pressing Enter. You will then also see the variable’s type and length. To inspect objects and lists more closely, a double-click is also sufficient. “Locals” and “Globals” refer to the areas where local (visible in the current program) and global (visible everywhere) variables are displayed.
We’ll start with the default view. However, the debugger windows can be customized using the icons on the side. Depending on your preference, you can also use the “Desktop 1”, “Desktop 2”, and “Desktop 3” views.
Navigation
An ABAP program is executed by a user or an automated process—for example, an external system—initiating a transaction. It’s important to understand that the code lines are generally executed sequentially, one after the other. When a line of code in a subroutine calls a method or function, a new stack entry is created and processed first before the main program can continue.
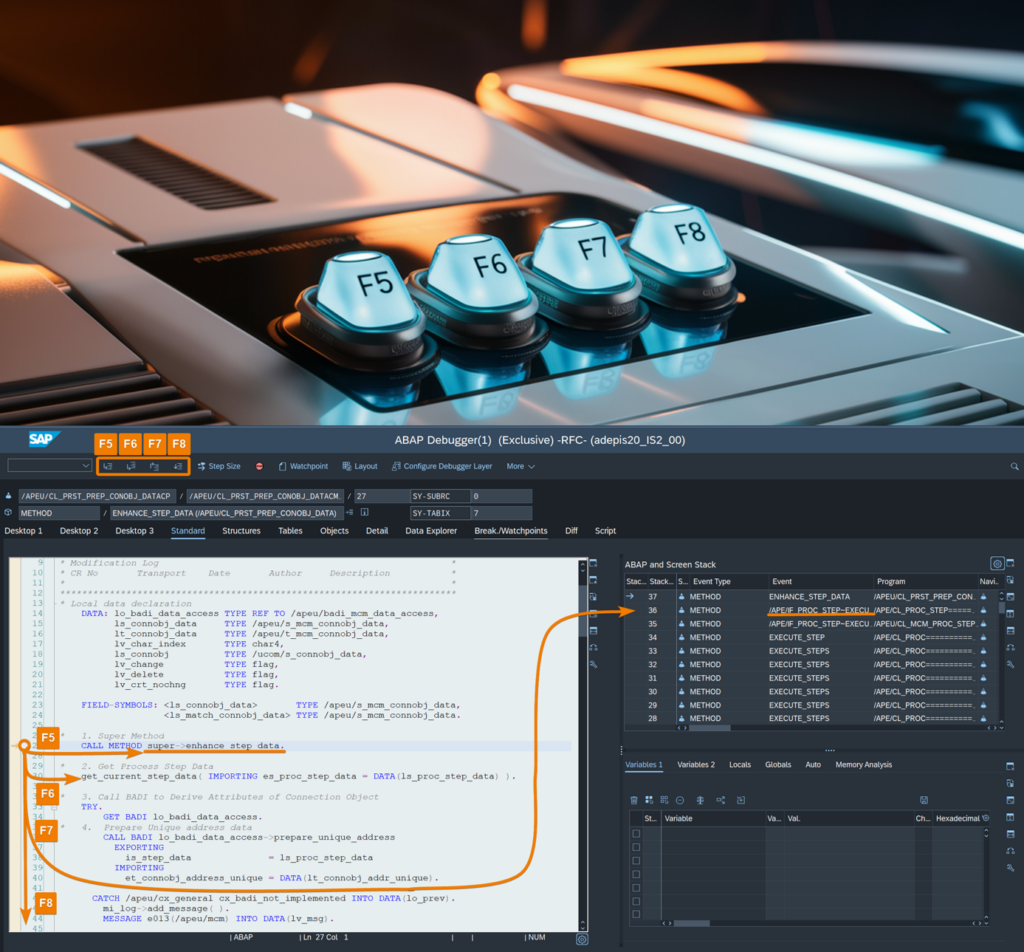
This is where navigation keys come into play. It’s best to get used to the shortcuts F5, F6, F7, and F8 right away.
The most important keys for debugging
- F5 executes the current line of code and, if possible, enters a subroutine, method, or function. This is useful when you’re searching for a bug deep within the code. This key is your searchlight.
- F6 executes the current line of code while remaining in the same program. This has the advantage of allowing you to progress faster, but it also makes it easier to overlook something. It’s your turbo button.
- F7 executes all lines of code in the current program and jumps to the calling program on the stack. This allows you to “reappear”.
- Pressing F8 executes all lines of code to the end. If you don’t encounter any further breakpoints, the debugger will close. Your flight is now over, and you can exit.
Now that we know how to move around to find errors, we first need to know how to recognize an error in the first place.
Correctly identify errors
Errors in ABAP can be multifaceted. Many generations of SAP releases have transformed the system into a complex software onion, with numerous different syntactic codes and technologies embedded within its layers. I’ll introduce you to the classic errors you should always keep in mind.
Sy-Subrc
The most fundamental indicator of an error is the system variable Sy-Subrc. It’s so important that it’s directly integrated into the debugging cockpit (top right). It tells you whether everything is OK or if a problem has occurred. The variable is typically modified by function modules and database accesses. If Sy-Subrc has the value null, then the database access was successful. You can remember: if Sy-Subrc is null, there were no errors; if Sy-Subrc has the value 4, then a problem has occurred. The meaning of the actual value isn’t uniformly defined and depends on the context. This means, however, that you should take a closer look at the SQL statement or function module.
Try – Catch
The syntactic construct Try-Catch is an error handling mechanism that the developer considers during development. For example, an attempt to divide a number by zero would normally lead to a short dump (crash) and terminate the ABAP program. However, if it’s enclosed in a Try-Catch block, the “Catch” block is executed in case of an error, thus handling the error in a controlled manner. It acts like a parachute, safely bringing the program to the ground in an emergency. Therefore, if you see a Catch block being executed, you should examine the Try block’s contents more closely. Keep in mind that all the above observations don’t necessarily indicate an error or problem. Often, the program behavior is intentional and further protected by system sub-checks or a Try-Catch block.
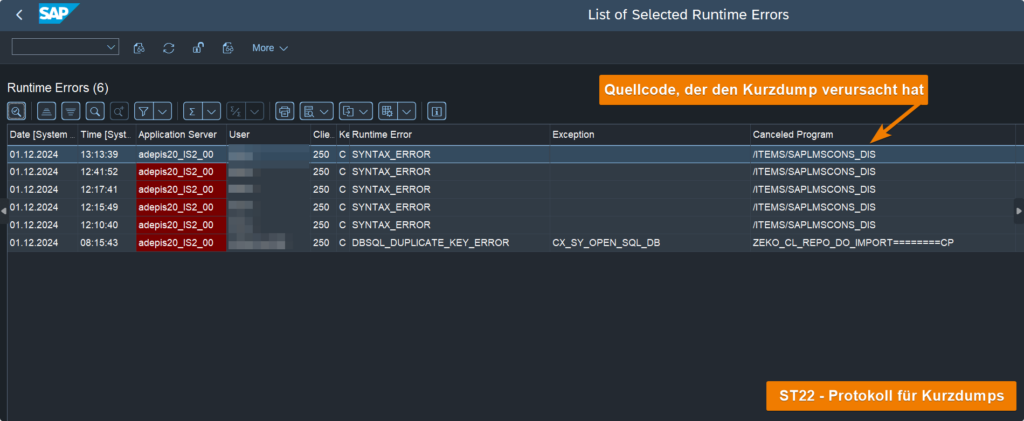
Short dump
A short dump in the SAP world is the equivalent of the Blue Screen of Death in Windows, which almost every Windows user has experienced at some point. The short dump almost certainly indicates a problem. Often, the issue is that the ABAP program was populated with incorrect data: for example, characters that are too long or too short, or a number that was expected but a string that was entered.
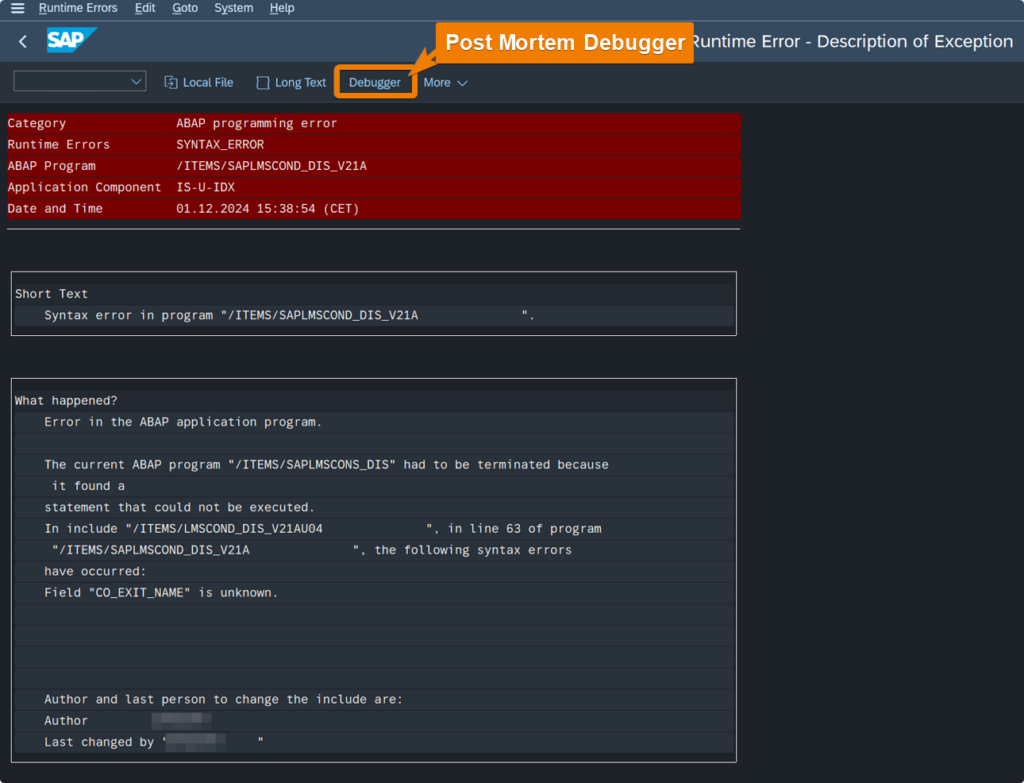
To identify the error more precisely, we use the post-mortem debugger. This allows us to jump back to the point where the problem occurred. It’s comparable to a black box that provides more detailed information about the accident after a crash.
What strategies exist for finding errors?
What’s the best way to find a Sith Lord in the galaxy? Searching every star and planet individually? That would take too long. Dividing the galaxy into solar systems and checking them randomly? You’d probably miss important clues that way.
Binary search is particularly efficient here. Divide the code into two halves and set a breakpoint in the middle. If the problem occurs before the breakpoint, examine the code up to that half. If the problem occurs after that half, logically examine the subsequent code. This way, you’ve halved the search space. Repeat this process until you can narrow down the problem.
How should you proceed if you don’t know which code is being executed? The following strategies can help:
Getting started is easy – with this tip
If the error occurs while executing or operating an SAP transaction, you can enter /h in the transaction bar, as described at the beginning, and then repeat the entry to reproduce the error. The debugger will then start in the processing logic for the user interface. Using the deep dive technique explained later, we can work our way through to the underlying application logic.
Solve the puzzle starting from the corners.
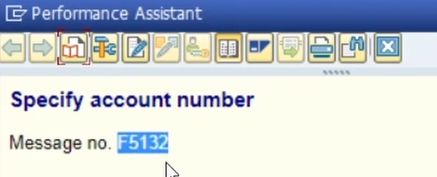
How was it noticed that an error might have occurred? Is the data in a transaction different than expected? Was a short dump displayed? With this strategy, start identifying the error from the end. Let’s look at a concrete example. While processing the transaction, the error F5132 visible in the screenshot occurred. This message is therefore at the end of the causal chain that led to the error.
Now we will work our way to the cause of the error by using a message-based breakpoint. To do this, we restart the debugger and create the breakpoint as shown in the screenshot below.
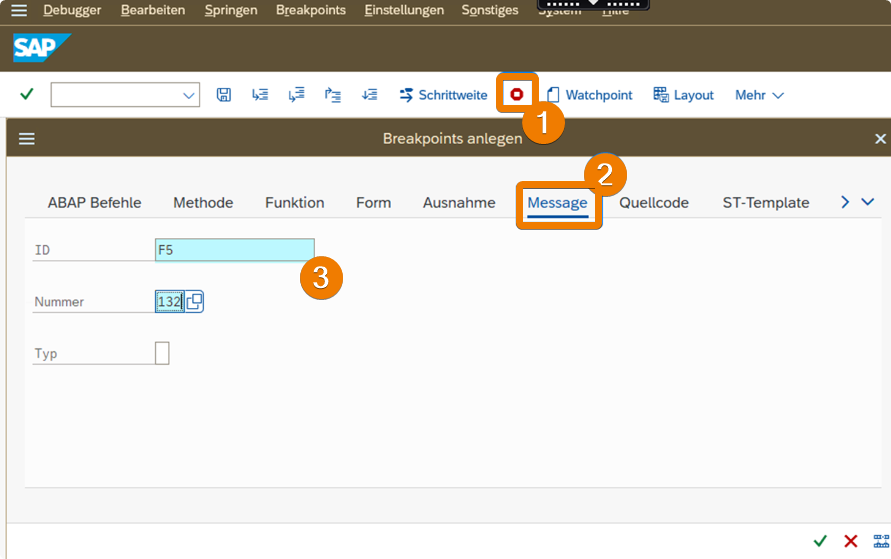
Now we close the debugger and call the transaction with the error message again. Instead of the message, the debugger now opens at the exact point in the ABAP program that triggered the message. Using the call stack, we can now identify the previously executed code. The where-used list can also be used for further analysis. Thus, the puzzle gradually comes together.
Follow the clues carefully – monitor variables correctly
Just as a pilot constantly monitors their altitude, speed, and angle of attack, we in the debugger must keep a constant eye on the variables relevant to us. This is the only way to notice if data is lost or incorrectly passed and saved. This is where the variable display comes in. Double-clicking a variable name in the source code automatically adds the variable name, type, and value to the display. If it’s a literal (number or string), the value is displayed directly. For objects, references, and internal tables, a second double-click on the value in the variable display is required to inspect the individual entries.
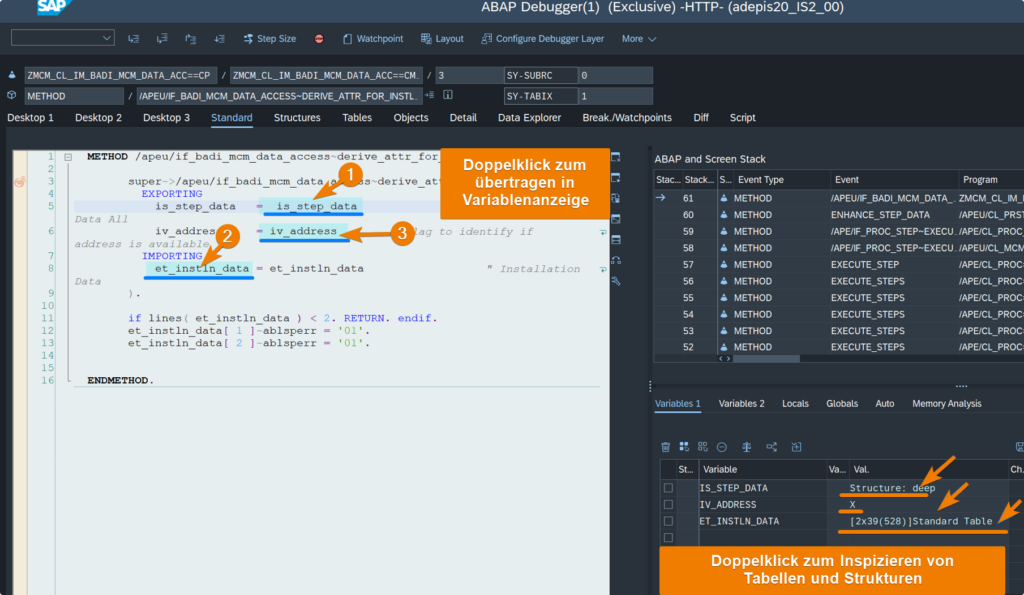
To begin with, it’s worthwhile to look at every variable stored in main memory. But which variables are particularly important? A function call has input and output parameters. These usually have a prefix called “iv” (importing variable) or “ev” (exporting variable). Before calling a function, you should check the inputs, and after calling a function, you should check the output. Just like you would check the inputs and outputs if you sent your 12-year-old son to the bakery with €20 and he came back with a big bag of sweets instead of bread.
Deep-Dive
With a deep dive, you go as deep as you possibly can. By intensively using the F5 key, you go through each line until something catches your eye or seems odd. The advantage of this strategy is that you won’t miss anything. However, this method is also the most time-consuming, and you’ll quickly get lost in SAP standard code or macros that are about as easy to decipher as Egyptian hieroglyphs. The more precisely you’ve narrowed down the problem, the more effective this technique becomes.
Found a mistake? Try out the suggested solutions!
Using the techniques mentioned so far, you are able to identify and isolate errors and inconsistencies. Now the search for a solution begins. A solution could be simply filling out a customizing table, activating a BADI, or assigning authorizations. If this isn’t sufficient, I’ll reveal some powerful tricks that must be used with caution. They will help you try out possible solutions and test scenarios. Note: These practices are to be used exclusively in development and quality assurance systems. Their use in production systems can have serious consequences.
Jedi mind tricks
Stormtrooper: “Halt! Your papers, please.”
Obi-Wan: “These are not the droids you are looking for.”
Stormtrooper: “These are not the droids we are looking for.”
Obi-Wan: “It can happen.”
Stormtrooper: “It can happen.”
Obi-Wan: “Drive on.”
Stormtroopers: “Keep going, keep going!”
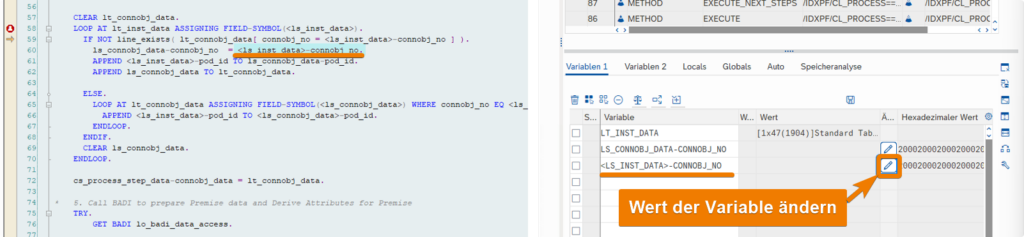
Just as Obi-Wan altered the stormtroopers’ thoughts, we can change the state of the current runtime variable in the debugger. This allows us to test: How would the process have continued if our database query had returned the correct result? Or: What result would the function block have returned if we had given it a different house number? Your creativity is (almost) limitless here.
In the following example, we see that the code is called with an empty value for the connection object number variable. This will later lead to an error in the process. The value of the variable can be easily changed by clicking the pencil icon. Now we can select a correct connection object number from the system, insert it, and confirm with Enter.
It’s worth noting that the import variables of a method cannot be changed. Often, a workaround is to modify the parameters passed to the calling method to circumvent this limitation.
Skip code
The ability to skip code is the most powerful permission and should only be used in testing and quality assurance systems. In the following example, the connection object number is again empty, which will cause the catch statement and the raise_exception method to be triggered. We want to prevent this, so we move the mouse to the end of the section and right-click, selecting “Jump to Statement.” This allows us to continue testing the subsequent code.
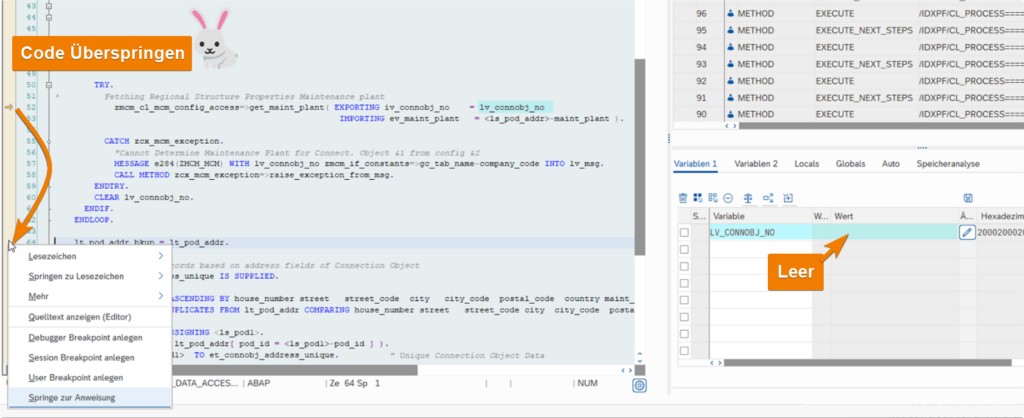
However, caution is advised here, as skipping code can cause subsequent errors. Always keep this in mind.
Now that we’ve covered the basics of debugging, it’s time to gain some practical experience. But how can the techniques learned in this article be applied to a concrete example? And what are the common pitfalls to watch out for when debugging? We’ll address these questions in more detail in upcoming articles.
Ask us!
If you’re still stuck after reading all these tips and tricks, feel free to contact our SAP professionals at adesso orange. With our extensive project experience, we’re here to support you and your team in successfully implementing SAP.